apt1
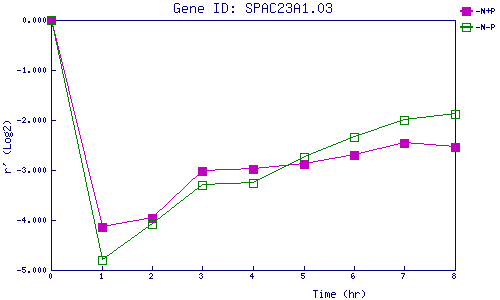
| 0 | 1 | 2 | 3 | 4 | 5 | 6 | 7 | 8 | |
| -N+P | 0.000 | -4.148 | -3.970 | -3.012 | -2.971 | -2.884 | -2.703 | -2.457 | -2.548 |
| -N-P | 0.000 | -4.809 | -4.079 | -3.306 | -3.263 | -2.733 | -2.338 | -1.999 | -1.882 |
|
-N+P: Nitrogen starved in the presence of P-factor -N-P: Nitrogen starved in the absence of P-factor |