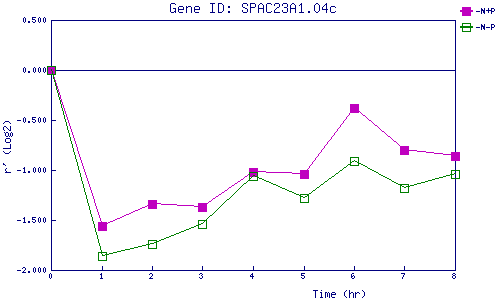
| 0 | 1 | 2 | 3 | 4 | 5 | 6 | 7 | 8 | |
| -N+P | 0.000 | -1.562 | -1.342 | -1.372 | -1.024 | -1.040 | -0.376 | -0.796 | -0.864 |
| -N-P | 0.000 | -1.855 | -1.736 | -1.539 | -1.063 | -1.275 | -0.913 | -1.177 | -1.035 |
|
-N+P: Nitrogen starved in the presence of P-factor -N-P: Nitrogen starved in the absence of P-factor |