rpl34
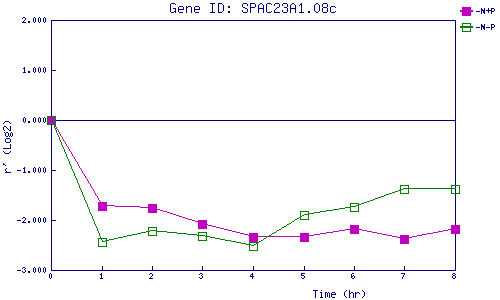
| 0 | 1 | 2 | 3 | 4 | 5 | 6 | 7 | 8 | |
| -N+P | 0.000 | -1.711 | -1.768 | -2.078 | -2.347 | -2.341 | -2.189 | -2.379 | -2.183 |
| -N-P | 0.000 | -2.431 | -2.226 | -2.325 | -2.514 | -1.896 | -1.740 | -1.385 | -1.371 |
|
-N+P: Nitrogen starved in the presence of P-factor -N-P: Nitrogen starved in the absence of P-factor |