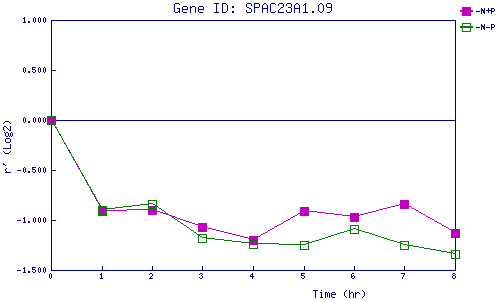
| 0 | 1 | 2 | 3 | 4 | 5 | 6 | 7 | 8 | |
| -N+P | 0.000 | -0.912 | -0.896 | -1.070 | -1.199 | -0.912 | -0.966 | -0.841 | -1.128 |
| -N-P | 0.000 | -0.904 | -0.844 | -1.182 | -1.236 | -1.248 | -1.090 | -1.251 | -1.337 |
|
-N+P: Nitrogen starved in the presence of P-factor -N-P: Nitrogen starved in the absence of P-factor |