rpl13a-2 rpl16-2 rpl1602
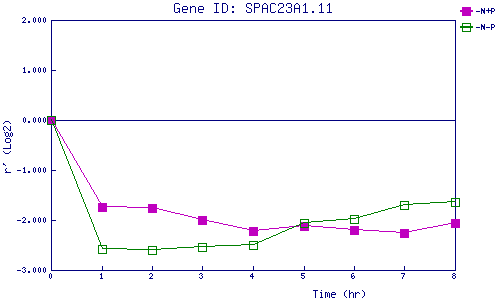
| 0 | 1 | 2 | 3 | 4 | 5 | 6 | 7 | 8 | |
| -N+P | 0.000 | -1.745 | -1.750 | -2.002 | -2.211 | -2.110 | -2.199 | -2.258 | -2.060 |
| -N-P | 0.000 | -2.574 | -2.605 | -2.544 | -2.501 | -2.066 | -1.978 | -1.706 | -1.636 |
|
-N+P: Nitrogen starved in the presence of P-factor -N-P: Nitrogen starved in the absence of P-factor |