rps23
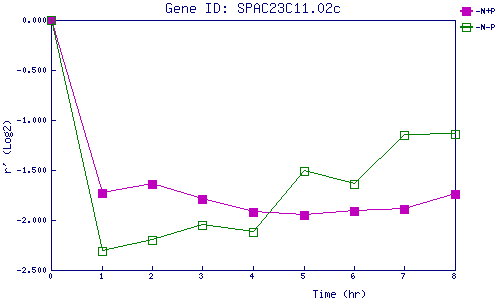
| 0 | 1 | 2 | 3 | 4 | 5 | 6 | 7 | 8 | |
| -N+P | 0.000 | -1.727 | -1.641 | -1.787 | -1.922 | -1.949 | -1.913 | -1.890 | -1.743 |
| -N-P | 0.000 | -2.306 | -2.200 | -2.047 | -2.116 | -1.512 | -1.640 | -1.150 | -1.140 |
|
-N+P: Nitrogen starved in the presence of P-factor -N-P: Nitrogen starved in the absence of P-factor |