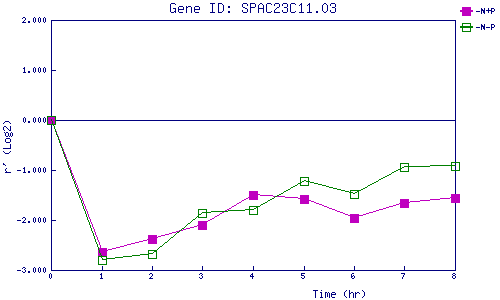
| 0 | 1 | 2 | 3 | 4 | 5 | 6 | 7 | 8 | |
| -N+P | 0.000 | -2.649 | -2.378 | -2.094 | -1.501 | -1.582 | -1.957 | -1.654 | -1.552 |
| -N-P | 0.000 | -2.802 | -2.671 | -1.861 | -1.803 | -1.212 | -1.481 | -0.939 | -0.920 |
|
-N+P: Nitrogen starved in the presence of P-factor -N-P: Nitrogen starved in the absence of P-factor |