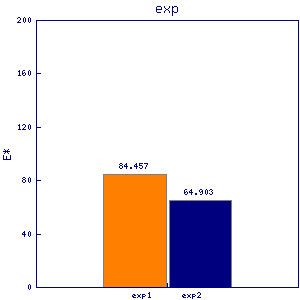
ppa1 ppa
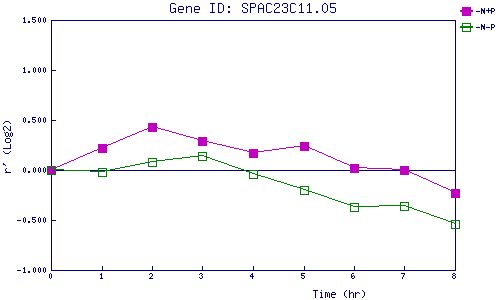
| 0 | 1 | 2 | 3 | 4 | 5 | 6 | 7 | 8 | |
| -N+P | 0.000 | 0.215 | 0.433 | 0.291 | 0.166 | 0.235 | 0.025 | 0.004 | -0.232 |
| -N-P | 0.000 | -0.016 | 0.081 | 0.141 | -0.035 | -0.196 | -0.373 | -0.355 | -0.536 |
|
-N+P: Nitrogen starved in the presence of P-factor -N-P: Nitrogen starved in the absence of P-factor |