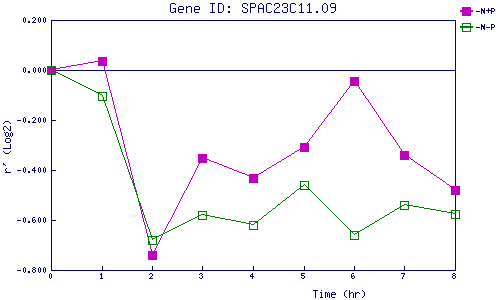
| 0 | 1 | 2 | 3 | 4 | 5 | 6 | 7 | 8 | |
| -N+P | 0.000 | 0.036 | -0.740 | -0.354 | -0.432 | -0.309 | -0.043 | -0.339 | -0.480 |
| -N-P | 0.000 | -0.106 | -0.682 | -0.581 | -0.621 | -0.460 | -0.661 | -0.541 | -0.574 |
|
-N+P: Nitrogen starved in the presence of P-factor -N-P: Nitrogen starved in the absence of P-factor |