cka1 orb5
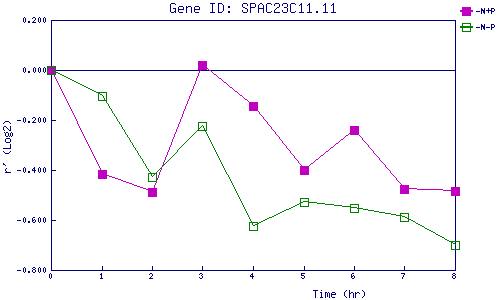
| 0 | 1 | 2 | 3 | 4 | 5 | 6 | 7 | 8 | |
| -N+P | 0.000 | -0.414 | -0.486 | 0.020 | -0.145 | -0.401 | -0.242 | -0.476 | -0.484 |
| -N-P | 0.000 | -0.106 | -0.429 | -0.222 | -0.624 | -0.529 | -0.551 | -0.588 | -0.701 |
|
-N+P: Nitrogen starved in the presence of P-factor -N-P: Nitrogen starved in the absence of P-factor |