zhf1 zhf
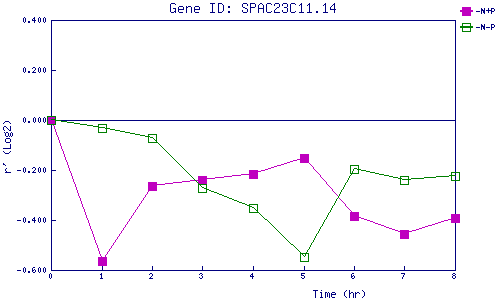
| 0 | 1 | 2 | 3 | 4 | 5 | 6 | 7 | 8 | |
| -N+P | 0.000 | -0.563 | -0.265 | -0.240 | -0.216 | -0.154 | -0.384 | -0.454 | -0.391 |
| -N-P | 0.000 | -0.032 | -0.072 | -0.271 | -0.351 | -0.549 | -0.195 | -0.240 | -0.222 |
|
-N+P: Nitrogen starved in the presence of P-factor -N-P: Nitrogen starved in the absence of P-factor |