crn1
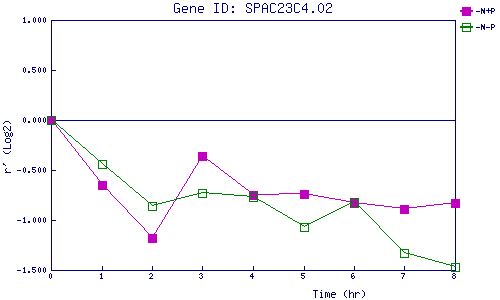
| 0 | 1 | 2 | 3 | 4 | 5 | 6 | 7 | 8 | |
| -N+P | 0.000 | -0.647 | -1.177 | -0.364 | -0.747 | -0.745 | -0.833 | -0.886 | -0.830 |
| -N-P | 0.000 | -0.443 | -0.861 | -0.733 | -0.773 | -1.067 | -0.819 | -1.326 | -1.467 |
|
-N+P: Nitrogen starved in the presence of P-factor -N-P: Nitrogen starved in the absence of P-factor |