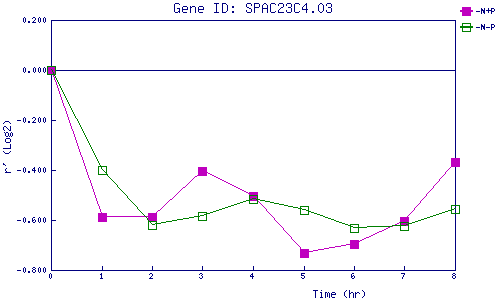
| 0 | 1 | 2 | 3 | 4 | 5 | 6 | 7 | 8 | |
| -N+P | 0.000 | -0.588 | -0.587 | -0.404 | -0.502 | -0.731 | -0.696 | -0.605 | -0.369 |
| -N-P | 0.000 | -0.400 | -0.619 | -0.584 | -0.516 | -0.562 | -0.633 | -0.623 | -0.555 |
|
-N+P: Nitrogen starved in the presence of P-factor -N-P: Nitrogen starved in the absence of P-factor |