| 0 | 1 | 2 | 3 | 4 | 5 | 6 | 7 | 8 | |
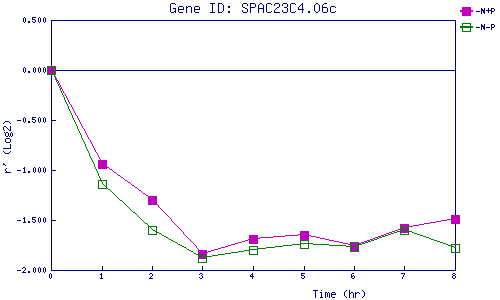
| -N+P | 0.000 | -0.939 | -1.297 | -1.839 | -1.695 | -1.652 | -1.755 | -1.584 | -1.489 |
| -N-P | 0.000 | -1.141 | -1.600 | -1.883 | -1.800 | -1.740 | -1.767 | -1.604 | -1.777 |
|
-N+P: Nitrogen starved in the presence of P-factor -N-P: Nitrogen starved in the absence of P-factor |