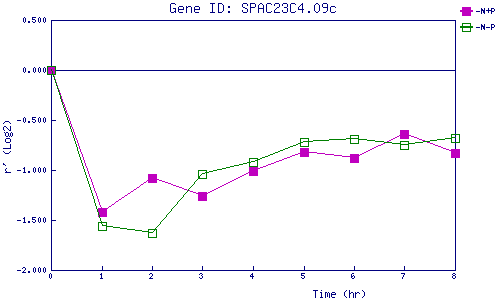
| 0 | 1 | 2 | 3 | 4 | 5 | 6 | 7 | 8 | |
| -N+P | 0.000 | -1.425 | -1.075 | -1.265 | -1.014 | -0.818 | -0.875 | -0.644 | -0.828 |
| -N-P | 0.000 | -1.558 | -1.630 | -1.042 | -0.924 | -0.725 | -0.690 | -0.747 | -0.681 |
|
-N+P: Nitrogen starved in the presence of P-factor -N-P: Nitrogen starved in the absence of P-factor |