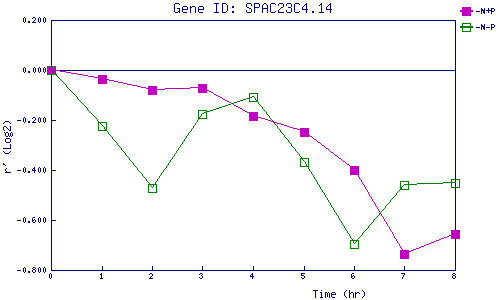
| 0 | 1 | 2 | 3 | 4 | 5 | 6 | 7 | 8 | |
| -N+P | 0.000 | -0.037 | -0.081 | -0.073 | -0.185 | -0.247 | -0.401 | -0.735 | -0.657 |
| -N-P | 0.000 | -0.225 | -0.470 | -0.176 | -0.108 | -0.369 | -0.694 | -0.459 | -0.453 |
|
-N+P: Nitrogen starved in the presence of P-factor -N-P: Nitrogen starved in the absence of P-factor |