rpb5
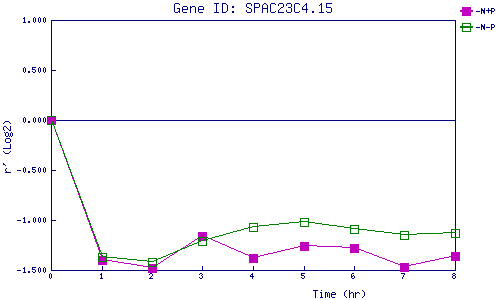
| 0 | 1 | 2 | 3 | 4 | 5 | 6 | 7 | 8 | |
| -N+P | 0.000 | -1.403 | -1.485 | -1.156 | -1.376 | -1.262 | -1.278 | -1.473 | -1.361 |
| -N-P | 0.000 | -1.368 | -1.418 | -1.211 | -1.072 | -1.022 | -1.090 | -1.152 | -1.133 |
|
-N+P: Nitrogen starved in the presence of P-factor -N-P: Nitrogen starved in the absence of P-factor |