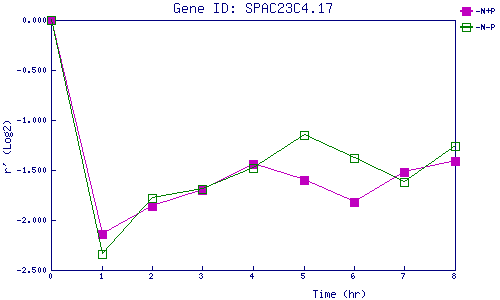
| 0 | 1 | 2 | 3 | 4 | 5 | 6 | 7 | 8 | |
| -N+P | 0.000 | -2.143 | -1.862 | -1.698 | -1.436 | -1.600 | -1.825 | -1.516 | -1.409 |
| -N-P | 0.000 | -2.339 | -1.780 | -1.688 | -1.475 | -1.148 | -1.385 | -1.617 | -1.257 |
|
-N+P: Nitrogen starved in the presence of P-factor -N-P: Nitrogen starved in the absence of P-factor |