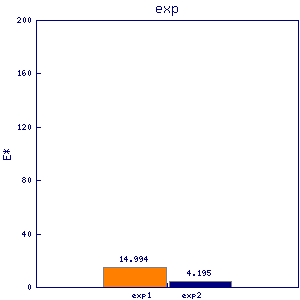
spt5
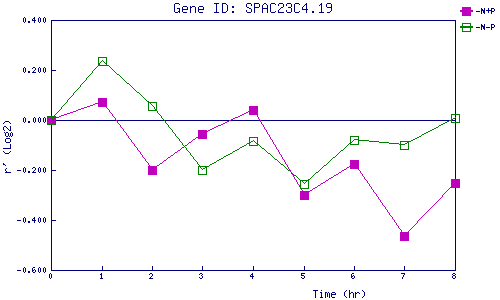
| 0 | 1 | 2 | 3 | 4 | 5 | 6 | 7 | 8 | |
| -N+P | 0.000 | 0.071 | -0.201 | -0.054 | 0.038 | -0.301 | -0.177 | -0.463 | -0.253 |
| -N-P | 0.000 | 0.235 | 0.054 | -0.198 | -0.084 | -0.258 | -0.082 | -0.100 | 0.010 |
|
-N+P: Nitrogen starved in the presence of P-factor -N-P: Nitrogen starved in the absence of P-factor |