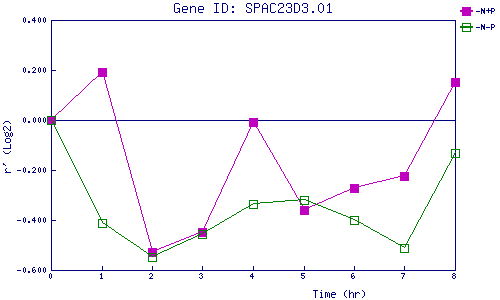
| 0 | 1 | 2 | 3 | 4 | 5 | 6 | 7 | 8 | |
| -N+P | 0.000 | 0.194 | -0.527 | -0.449 | -0.009 | -0.360 | -0.271 | -0.226 | 0.154 |
| -N-P | 0.000 | -0.413 | -0.547 | -0.454 | -0.337 | -0.318 | -0.398 | -0.513 | -0.133 |
|
-N+P: Nitrogen starved in the presence of P-factor -N-P: Nitrogen starved in the absence of P-factor |