rfc2
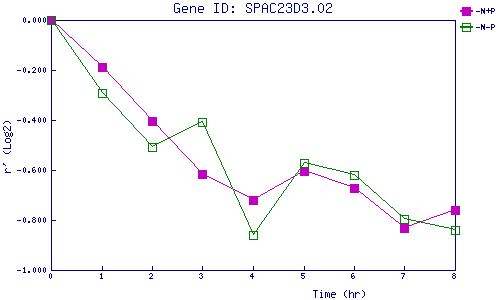
| 0 | 1 | 2 | 3 | 4 | 5 | 6 | 7 | 8 | |
| -N+P | 0.000 | -0.187 | -0.403 | -0.616 | -0.720 | -0.603 | -0.673 | -0.830 | -0.760 |
| -N-P | 0.000 | -0.291 | -0.509 | -0.408 | -0.861 | -0.572 | -0.621 | -0.797 | -0.841 |
|
-N+P: Nitrogen starved in the presence of P-factor -N-P: Nitrogen starved in the absence of P-factor |