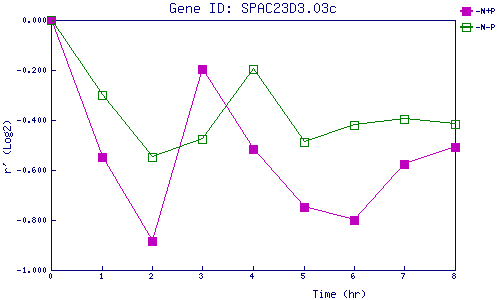
| 0 | 1 | 2 | 3 | 4 | 5 | 6 | 7 | 8 | |
| -N+P | 0.000 | -0.548 | -0.884 | -0.196 | -0.516 | -0.749 | -0.800 | -0.577 | -0.508 |
| -N-P | 0.000 | -0.299 | -0.549 | -0.476 | -0.197 | -0.488 | -0.421 | -0.396 | -0.417 |
|
-N+P: Nitrogen starved in the presence of P-factor -N-P: Nitrogen starved in the absence of P-factor |