gpd2
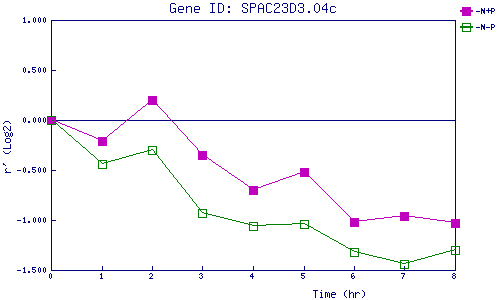
| 0 | 1 | 2 | 3 | 4 | 5 | 6 | 7 | 8 | |
| -N+P | 0.000 | -0.206 | 0.203 | -0.348 | -0.704 | -0.525 | -1.025 | -0.955 | -1.028 |
| -N-P | 0.000 | -0.436 | -0.303 | -0.929 | -1.059 | -1.042 | -1.320 | -1.439 | -1.302 |
|
-N+P: Nitrogen starved in the presence of P-factor -N-P: Nitrogen starved in the absence of P-factor |