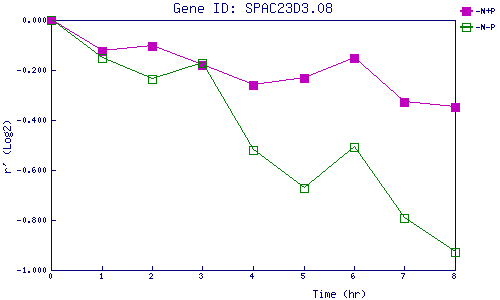
| 0 | 1 | 2 | 3 | 4 | 5 | 6 | 7 | 8 | |
| -N+P | 0.000 | -0.123 | -0.105 | -0.179 | -0.260 | -0.232 | -0.153 | -0.329 | -0.347 |
| -N-P | 0.000 | -0.151 | -0.235 | -0.173 | -0.520 | -0.674 | -0.507 | -0.793 | -0.927 |
|
-N+P: Nitrogen starved in the presence of P-factor -N-P: Nitrogen starved in the absence of P-factor |