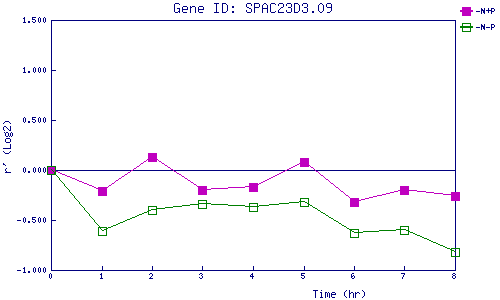
| 0 | 1 | 2 | 3 | 4 | 5 | 6 | 7 | 8 | |
| -N+P | 0.000 | -0.211 | 0.134 | -0.195 | -0.168 | 0.079 | -0.320 | -0.201 | -0.259 |
| -N-P | 0.000 | -0.611 | -0.403 | -0.343 | -0.367 | -0.318 | -0.629 | -0.597 | -0.825 |
|
-N+P: Nitrogen starved in the presence of P-factor -N-P: Nitrogen starved in the absence of P-factor |