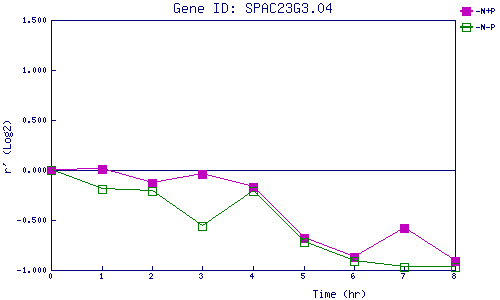
| 0 | 1 | 2 | 3 | 4 | 5 | 6 | 7 | 8 | |
| -N+P | 0.000 | 0.009 | -0.126 | -0.044 | -0.168 | -0.685 | -0.867 | -0.581 | -0.914 |
| -N-P | 0.000 | -0.188 | -0.213 | -0.560 | -0.211 | -0.724 | -0.910 | -0.969 | -0.974 |
|
-N+P: Nitrogen starved in the presence of P-factor -N-P: Nitrogen starved in the absence of P-factor |