| 0 | 1 | 2 | 3 | 4 | 5 | 6 | 7 | 8 | |
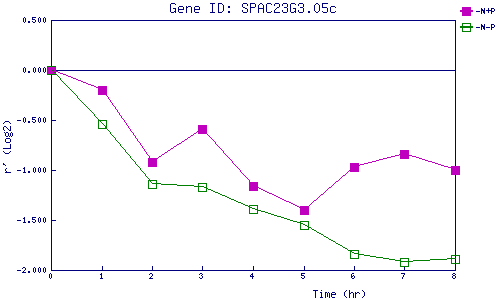
| -N+P | 0.000 | -0.195 | -0.924 | -0.594 | -1.157 | -1.396 | -0.974 | -0.841 | -0.998 |
| -N-P | 0.000 | -0.539 | -1.145 | -1.170 | -1.388 | -1.546 | -1.841 | -1.922 | -1.886 |
|
-N+P: Nitrogen starved in the presence of P-factor -N-P: Nitrogen starved in the absence of P-factor |