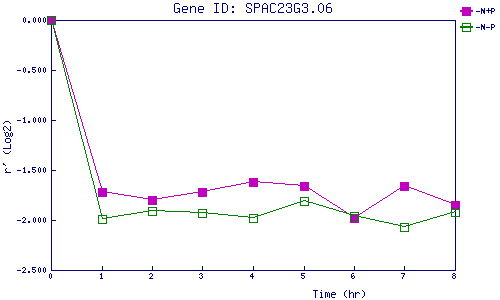
| 0 | 1 | 2 | 3 | 4 | 5 | 6 | 7 | 8 | |
| -N+P | 0.000 | -1.720 | -1.805 | -1.725 | -1.617 | -1.657 | -1.982 | -1.663 | -1.848 |
| -N-P | 0.000 | -1.990 | -1.910 | -1.928 | -1.977 | -1.813 | -1.964 | -2.074 | -1.916 |
|
-N+P: Nitrogen starved in the presence of P-factor -N-P: Nitrogen starved in the absence of P-factor |