reserved_name_ubp7
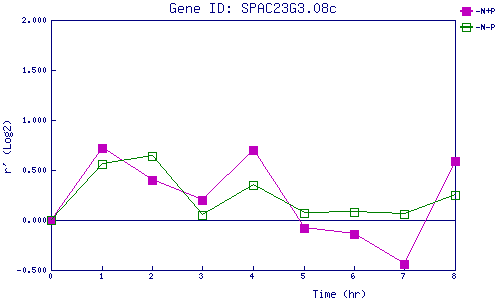
| 0 | 1 | 2 | 3 | 4 | 5 | 6 | 7 | 8 | |
| -N+P | 0.000 | 0.725 | 0.400 | 0.203 | 0.705 | -0.080 | -0.142 | -0.436 | 0.590 |
| -N-P | 0.000 | 0.564 | 0.637 | 0.049 | 0.351 | 0.071 | 0.078 | 0.060 | 0.246 |
|
-N+P: Nitrogen starved in the presence of P-factor -N-P: Nitrogen starved in the absence of P-factor |