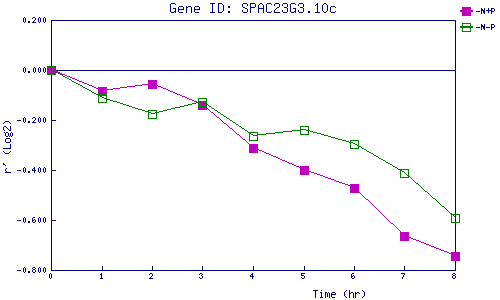
| 0 | 1 | 2 | 3 | 4 | 5 | 6 | 7 | 8 | |
| -N+P | 0.000 | -0.085 | -0.058 | -0.139 | -0.311 | -0.401 | -0.474 | -0.664 | -0.742 |
| -N-P | 0.000 | -0.113 | -0.175 | -0.126 | -0.263 | -0.239 | -0.296 | -0.412 | -0.591 |
|
-N+P: Nitrogen starved in the presence of P-factor -N-P: Nitrogen starved in the absence of P-factor |