rpn6
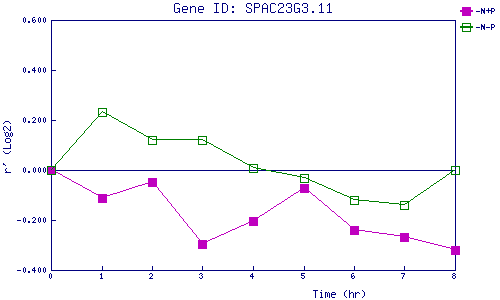
| 0 | 1 | 2 | 3 | 4 | 5 | 6 | 7 | 8 | |
| -N+P | 0.000 | -0.114 | -0.050 | -0.294 | -0.203 | -0.070 | -0.240 | -0.269 | -0.319 |
| -N-P | 0.000 | 0.232 | 0.119 | 0.120 | 0.007 | -0.032 | -0.120 | -0.140 | -0.002 |
|
-N+P: Nitrogen starved in the presence of P-factor -N-P: Nitrogen starved in the absence of P-factor |