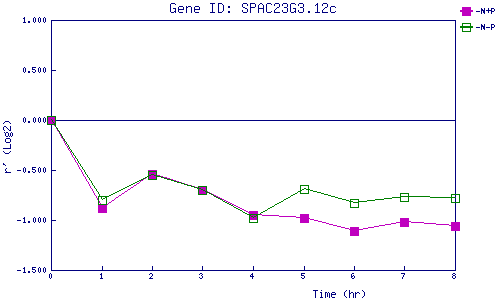
| 0 | 1 | 2 | 3 | 4 | 5 | 6 | 7 | 8 | |
| -N+P | 0.000 | -0.881 | -0.539 | -0.701 | -0.950 | -0.978 | -1.110 | -1.020 | -1.061 |
| -N-P | 0.000 | -0.798 | -0.553 | -0.697 | -0.978 | -0.687 | -0.826 | -0.774 | -0.785 |
|
-N+P: Nitrogen starved in the presence of P-factor -N-P: Nitrogen starved in the absence of P-factor |