ini1
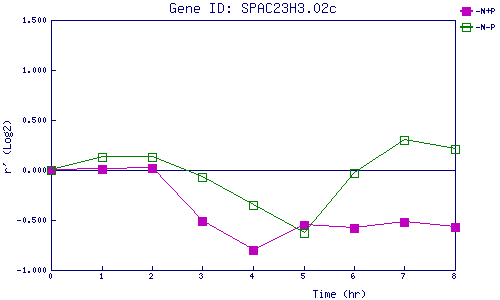
| 0 | 1 | 2 | 3 | 4 | 5 | 6 | 7 | 8 | |
| -N+P | 0.000 | 0.014 | 0.021 | -0.513 | -0.804 | -0.548 | -0.581 | -0.519 | -0.574 |
| -N-P | 0.000 | 0.130 | 0.130 | -0.070 | -0.346 | -0.631 | -0.027 | 0.301 | 0.211 |
|
-N+P: Nitrogen starved in the presence of P-factor -N-P: Nitrogen starved in the absence of P-factor |