swd1
| 0 | 1 | 2 | 3 | 4 | 5 | 6 | 7 | 8 | |
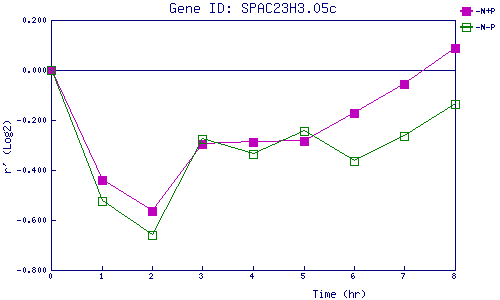
| -N+P | 0.000 | -0.439 | -0.564 | -0.298 | -0.290 | -0.284 | -0.172 | -0.054 | 0.087 |
| -N-P | 0.000 | -0.525 | -0.661 | -0.276 | -0.338 | -0.243 | -0.363 | -0.265 | -0.135 |
|
-N+P: Nitrogen starved in the presence of P-factor -N-P: Nitrogen starved in the absence of P-factor |