apl6
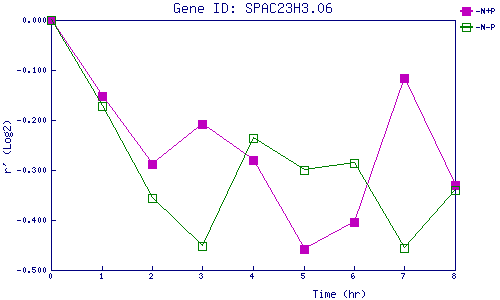
| 0 | 1 | 2 | 3 | 4 | 5 | 6 | 7 | 8 | |
| -N+P | 0.000 | -0.153 | -0.287 | -0.209 | -0.281 | -0.458 | -0.403 | -0.117 | -0.330 |
| -N-P | 0.000 | -0.172 | -0.356 | -0.453 | -0.235 | -0.300 | -0.286 | -0.457 | -0.341 |
|
-N+P: Nitrogen starved in the presence of P-factor -N-P: Nitrogen starved in the absence of P-factor |