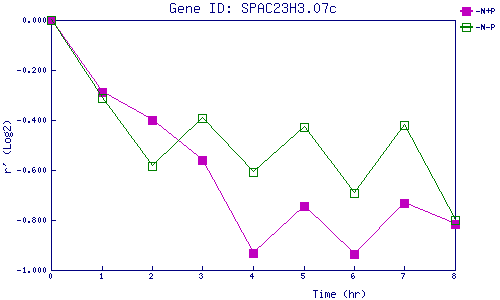
| 0 | 1 | 2 | 3 | 4 | 5 | 6 | 7 | 8 | |
| -N+P | 0.000 | -0.286 | -0.399 | -0.562 | -0.931 | -0.742 | -0.937 | -0.733 | -0.817 |
| -N-P | 0.000 | -0.314 | -0.584 | -0.394 | -0.608 | -0.427 | -0.693 | -0.421 | -0.802 |
|
-N+P: Nitrogen starved in the presence of P-factor -N-P: Nitrogen starved in the absence of P-factor |