bub3
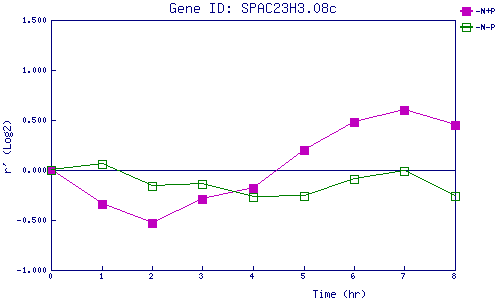
| 0 | 1 | 2 | 3 | 4 | 5 | 6 | 7 | 8 | |
| -N+P | 0.000 | -0.340 | -0.534 | -0.289 | -0.176 | 0.195 | 0.475 | 0.600 | 0.447 |
| -N-P | 0.000 | 0.055 | -0.161 | -0.144 | -0.274 | -0.255 | -0.090 | -0.009 | -0.256 |
|
-N+P: Nitrogen starved in the presence of P-factor -N-P: Nitrogen starved in the absence of P-factor |