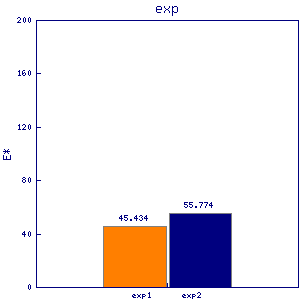
gly1
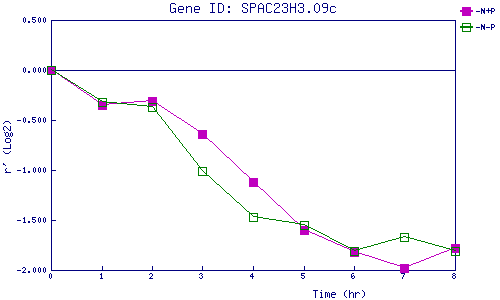
| 0 | 1 | 2 | 3 | 4 | 5 | 6 | 7 | 8 | |
| -N+P | 0.000 | -0.352 | -0.306 | -0.645 | -1.119 | -1.600 | -1.816 | -1.981 | -1.775 |
| -N-P | 0.000 | -0.321 | -0.370 | -1.010 | -1.466 | -1.548 | -1.814 | -1.668 | -1.809 |
|
-N+P: Nitrogen starved in the presence of P-factor -N-P: Nitrogen starved in the absence of P-factor |