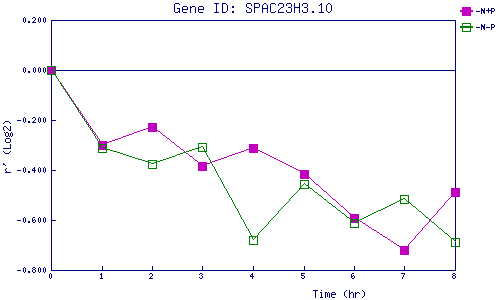
| 0 | 1 | 2 | 3 | 4 | 5 | 6 | 7 | 8 | |
| -N+P | 0.000 | -0.300 | -0.229 | -0.382 | -0.314 | -0.416 | -0.591 | -0.719 | -0.486 |
| -N-P | 0.000 | -0.310 | -0.375 | -0.307 | -0.679 | -0.454 | -0.613 | -0.515 | -0.689 |
|
-N+P: Nitrogen starved in the presence of P-factor -N-P: Nitrogen starved in the absence of P-factor |