gpa2 git8
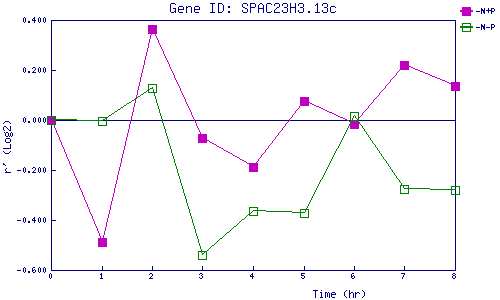
| 0 | 1 | 2 | 3 | 4 | 5 | 6 | 7 | 8 | |
| -N+P | 0.000 | -0.486 | 0.363 | -0.072 | -0.187 | 0.075 | -0.014 | 0.220 | 0.136 |
| -N-P | 0.000 | -0.005 | 0.130 | -0.541 | -0.365 | -0.372 | 0.018 | -0.275 | -0.278 |
|
-N+P: Nitrogen starved in the presence of P-factor -N-P: Nitrogen starved in the absence of P-factor |