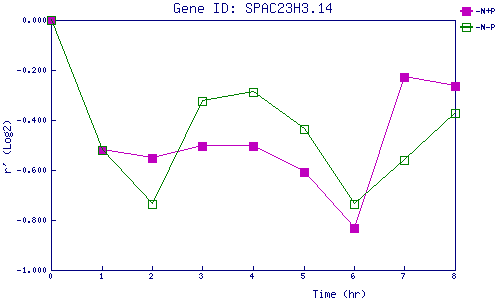
| 0 | 1 | 2 | 3 | 4 | 5 | 6 | 7 | 8 | |
| -N+P | 0.000 | -0.518 | -0.552 | -0.506 | -0.504 | -0.610 | -0.832 | -0.229 | -0.262 |
| -N-P | 0.000 | -0.521 | -0.738 | -0.325 | -0.290 | -0.437 | -0.736 | -0.561 | -0.371 |
|
-N+P: Nitrogen starved in the presence of P-factor -N-P: Nitrogen starved in the absence of P-factor |