erv25
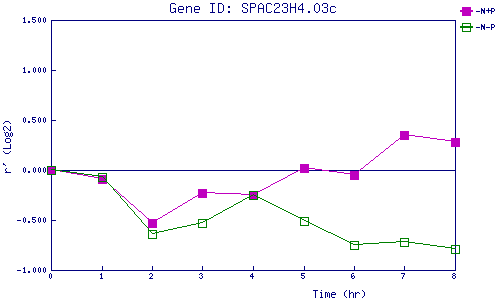
| 0 | 1 | 2 | 3 | 4 | 5 | 6 | 7 | 8 | |
| -N+P | 0.000 | -0.091 | -0.527 | -0.227 | -0.248 | 0.017 | -0.050 | 0.353 | 0.284 |
| -N-P | 0.000 | -0.068 | -0.636 | -0.526 | -0.247 | -0.508 | -0.746 | -0.715 | -0.787 |
|
-N+P: Nitrogen starved in the presence of P-factor -N-P: Nitrogen starved in the absence of P-factor |