| 0 | 1 | 2 | 3 | 4 | 5 | 6 | 7 | 8 | |
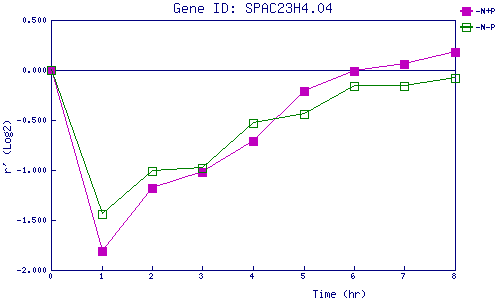
| -N+P | 0.000 | -1.806 | -1.177 | -1.023 | -0.709 | -0.213 | -0.013 | 0.058 | 0.185 |
| -N-P | 0.000 | -1.440 | -1.014 | -0.978 | -0.528 | -0.435 | -0.157 | -0.159 | -0.075 |
|
-N+P: Nitrogen starved in the presence of P-factor -N-P: Nitrogen starved in the absence of P-factor |
