srp102
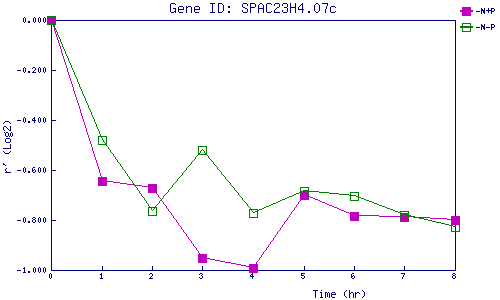
| 0 | 1 | 2 | 3 | 4 | 5 | 6 | 7 | 8 | |
| -N+P | 0.000 | -0.643 | -0.672 | -0.951 | -0.994 | -0.699 | -0.782 | -0.789 | -0.799 |
| -N-P | 0.000 | -0.482 | -0.764 | -0.520 | -0.772 | -0.684 | -0.705 | -0.781 | -0.828 |
|
-N+P: Nitrogen starved in the presence of P-factor -N-P: Nitrogen starved in the absence of P-factor |