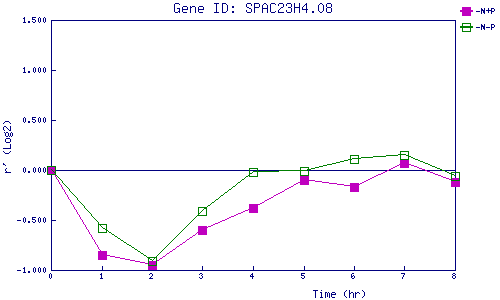
| 0 | 1 | 2 | 3 | 4 | 5 | 6 | 7 | 8 | |
| -N+P | 0.000 | -0.847 | -0.954 | -0.599 | -0.384 | -0.096 | -0.171 | 0.071 | -0.120 |
| -N-P | 0.000 | -0.575 | -0.914 | -0.410 | -0.019 | -0.008 | 0.113 | 0.154 | -0.064 |
|
-N+P: Nitrogen starved in the presence of P-factor -N-P: Nitrogen starved in the absence of P-factor |