cdb4
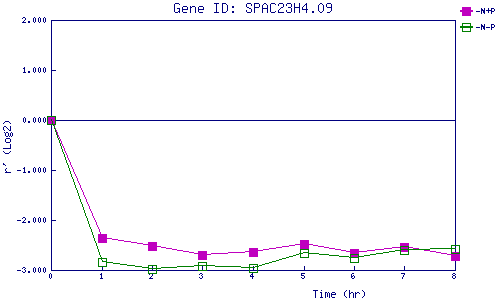
| 0 | 1 | 2 | 3 | 4 | 5 | 6 | 7 | 8 | |
| -N+P | 0.000 | -2.350 | -2.524 | -2.704 | -2.636 | -2.488 | -2.654 | -2.538 | -2.729 |
| -N-P | 0.000 | -2.843 | -2.976 | -2.916 | -2.970 | -2.652 | -2.755 | -2.599 | -2.585 |
|
-N+P: Nitrogen starved in the presence of P-factor -N-P: Nitrogen starved in the absence of P-factor |