thi4
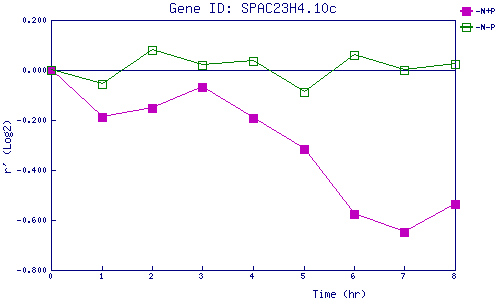
| 0 | 1 | 2 | 3 | 4 | 5 | 6 | 7 | 8 | |
| -N+P | 0.000 | -0.188 | -0.152 | -0.068 | -0.192 | -0.315 | -0.578 | -0.647 | -0.534 |
| -N-P | 0.000 | -0.056 | 0.082 | 0.021 | 0.035 | -0.087 | 0.059 | 0.001 | 0.025 |
|
-N+P: Nitrogen starved in the presence of P-factor -N-P: Nitrogen starved in the absence of P-factor |