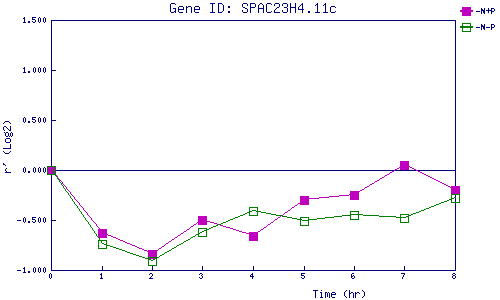
| 0 | 1 | 2 | 3 | 4 | 5 | 6 | 7 | 8 | |
| -N+P | 0.000 | -0.632 | -0.835 | -0.504 | -0.665 | -0.295 | -0.248 | 0.048 | -0.199 |
| -N-P | 0.000 | -0.745 | -0.912 | -0.622 | -0.407 | -0.506 | -0.454 | -0.478 | -0.283 |
|
-N+P: Nitrogen starved in the presence of P-factor -N-P: Nitrogen starved in the absence of P-factor |