alp13
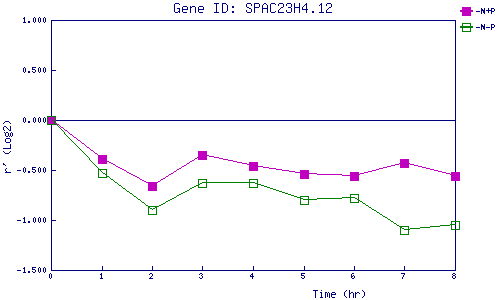
| 0 | 1 | 2 | 3 | 4 | 5 | 6 | 7 | 8 | |
| -N+P | 0.000 | -0.393 | -0.656 | -0.353 | -0.462 | -0.543 | -0.559 | -0.428 | -0.565 |
| -N-P | 0.000 | -0.533 | -0.896 | -0.632 | -0.627 | -0.796 | -0.776 | -1.102 | -1.051 |
|
-N+P: Nitrogen starved in the presence of P-factor -N-P: Nitrogen starved in the absence of P-factor |