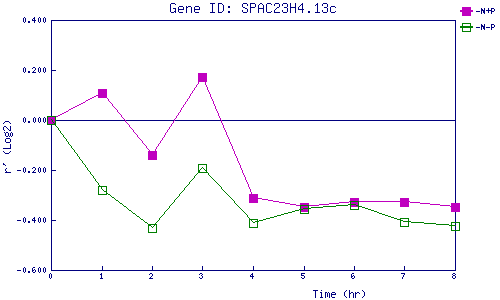
| 0 | 1 | 2 | 3 | 4 | 5 | 6 | 7 | 8 | |
| -N+P | 0.000 | 0.107 | -0.141 | 0.171 | -0.310 | -0.348 | -0.326 | -0.327 | -0.347 |
| -N-P | 0.000 | -0.278 | -0.432 | -0.190 | -0.411 | -0.357 | -0.339 | -0.407 | -0.422 |
|
-N+P: Nitrogen starved in the presence of P-factor -N-P: Nitrogen starved in the absence of P-factor |